

J.Konstapel Leiden, 7-10-2025.
deze blog gaat over de staat van de Nederlandse overheid,.
Die staat heb ik ik lang geleden onderzocht.met behulp vvan het Panarchie-model van Holling.
We verkeren in Laat-K.

De Politieke Spiraal
Recent heb ik een “meerdimensionaal politiek model” getoond dat de Links <-> Rechts-dichotomie doorbreekt door de rotatie met-en tegen de klok en op een neer te bewegen waardoor het een spiraal wordt.
Judging is top-down van de top. de regelaars, naar de bottom de burgers of klanten. van boven de wereld naar in de wereld.


Introductie
Overal ter wereld loopt de overheid volledig vast in zijn eigen bureaucratie en komt de burger in opstand of doet niet meer mee.
Wat is aan de hand en wat kunnen we doen.
Wilt U feiten? druk hier.
Read the english version click here.
Jump to the English Summary click here
Theorie
De samenleving lijkt op een ecologie en panarchie toont wat er gebeurt met een overgereguleerde bureaucratie
In dat geval stort de bureaucratie in elkaar (Collapse)..
Een bureaucratie kan zichzelf niet aanpassen vanwege het principe van de zelfreproductie (autopoiesis).
Een bureaucratie kan niet omgaan met complexiteit (geel, Surprise)..
De overheid maakt de maatschappij homogeen (taal, achternamen, adressen, kadasters) om te kunnen tellen, plannen en sturen. Deze vereenvoudiging negeert lokale, praktische kennis (mētis). In combinatie met top-down besturen leidt dat vaak tot mislukking.
Panarchy × Cynefin
Waarom deze combinatie?
Organisaties worstelen met een fundamentele spanning: sommigen zien “het systeem” (markten, ecosystemen), anderen willen “gewoon doen” (projecten, KPI’s). Panarchy laat zien waar je systeem zich bevindt in zijn ontwikkelingscyclus en op welke schaal. Cynefin vertelt je hoe je moet handelen in die specifieke context.
Panarchy in vogelvlucht
Complexe systemen doorlopen vier fasen:
- r (groei): Veel variatie, experimenten, kansen
- K (consolidatie): Efficiëntie, standaardisatie, minder variatie → kwetsbaarder
- Ω (release): Verstoring, ineenstorting, vrijkomen van vastgezette middelen
- α (reorganisatie): Nieuwe combinaties, kiemen voor volgende groei
Cruciaal: Systemen bestaan op meerdere schalen (team ↔ organisatie ↔ markt ↔ maatschappij) die elkaar beïnvloeden via:
- Revolt (opwaarts): Kleine verstoringen kunnen grotere systemen destabiliseren als die kwetsbaar zijn (late K)
- Remember (neerwaarts): Grotere systemen beperken en richten de reorganisatie van kleinere systemen
Cynefin in vogelvlucht
Vijf domeinen met elk een eigen handelingslogica:
- Clear: Duidelijke causaliteit → standaardiseren (Sense–Categorize–Respond)
- Complicated: Kenbare causaliteit → analyseren (Sense–Analyze–Respond)
- Complex: Patronen achteraf zichtbaar → experimenteren (Probe–Sense–Respond)
- Chaotic: Geen orde → stabiliseren (Act–Sense–Respond)
- Disorder: Onduidelijk → opsplitsen
Kernonderscheid: Governing constraints (hard, voor Clear/Complicated) vs. enabling constraints (richtinggevend, voor Complex).
De koppeling: 5 stappen
1. Benoem drie schalen
- Micro: teams, producten
- Meso: organisatie, keten
- Macro: markt, beleid, maatschappij
2. Bepaal de fase per schaal
Gebruik waarneembare indicatoren:
- Variatie (toe- of afnemend?)
- Reactietijd op verstoringen
- Storingsfrequentie en -ernst
- Diversiteit klanten/stakeholders
3. Koppel aan Cynefin-domein
- r/Complex → meerdere safe-to-fail experimenten
- K/Clear-Complicated → standaardiseren/optimaliseren (maar behoud redundantie!)
- Ω/Chaotic → eerst stabiliseren (72u), dan naar Complex
- α/Complex → patronen laten ontstaan, snel opschalen of stoppen
4. Tune constraints naar schaal
- Zeggenschap (micro/meso): governing constraints (SOP’s, contracten)
- Invloed (meso/macro): enabling constraints (principes, sandboxes, coalities)
- Check: Verkleint dit de opties op een andere schaal onnodig?
5. Ontwerp voor schaalsprongen
- Revolt-risico: In late K geen nieuwe harde regels zonder fragiliteitscheck; leading indicators instellen
- Remember-kracht: In α/Complex vertaal macroprincipes naar guardrails, niet naar detailregels
Praktijkvoorbeeld
Dienstverlener met dalende marges en klantuitval
- Macro (markt): α/Complex → 5 co-creatieprobes (6 weken, €25k), vooraf amplify/dampen-signalen
- Meso (operatie): K/Clear → behoud standaarden, maar: twee leveranciers actief, max 1 nieuwe regel per kwartaal
- Micro (team): r/Complex→Complicated → geslaagde probe wordt SOP binnen 2 sprints
Resultaat: consolideren waar het moet, experimenteren waar het kan, stabiliseren wanneer het moet.
Essentiële do’s & don’ts
Do
- Portfolio-aanpak: parallelle probes in Complex, kill/scale op vaste momenten
- Variatie bewaren in K: redundantie, modulariteit
- Exit-criteria: wanneer gaat iets van Complex → Complicated → Clear?
- Cross-scale signalen monitoren
Don’t
- Complex reduceren tot analyse zonder actie
- In late K nóg strakker regelen (rigidity trap)
- Chaotic laten voortmodderen (timebox stabilisatie!)
- Micro-optimalisaties die macro-fragiliteit veroorzaken
Praktische hulpmiddelen
Portfoliobord (A3):
- Kolommen: Clear | Complicated | Complex | Chaotic
- Rijen: Micro | Meso | Macro
- Kaarten: doel, hypothese, fase, constrainttype, meet- en stopsignalen
Probe-kaart: hypothese, kleinste signaal, amplify/dampen, max-risico, stopdatum
Stabilisatie-kaart: 72u-doel, rollen, terugkeercriteria naar Complex
SOP-kaart: bron (welke probe), KPI, auditfrequentie, unfreeze-conditie
In één zin
Panarchy leert je op de juiste schaal te kijken en de fase te herkennen; Cynefin helpt je vervolgens passend te handelen—samen voorkom je over-consolidatie, versnel je leren en vergroot je veerkracht door interventies af te stemmen op systeemfase in plaats van overal dezelfde hamer te gebruiken.
Feiten
Probleembeschrijving: Structurele wachttijden en stelselrigiditeit in Nederland
Executive Summary
Nederland kent in 2024-2025 aanhoudende of stijgende wachttijden in vrijwel alle publieke domeinen. De kernoorzaak is een structurele mismatch tussen vraag en adaptieve uitvoeringscapaciteit: de overheid kan mensen, middelen, IT en regie niet snel genoeg opschalen of sturen op doorstroom, waardoor elke schok zich opstapelt tot wachtrijen. Deze rigiditeit wordt versterkt door complexe regelgeving, gefragmenteerde governance, volumegerichte bekostiging en het ontbreken van harde wachttijdnormen.
1. Feitelijke probleemomvang per domein
1.1 Gezondheidszorg
GGZ (volwassenen en jeugd)
- Per 1 oktober 2024: 108.878 wachtplekken
- Meer dan de helft overschrijdt de Treeknorm (14 weken)
- NZa констатeert: “wachttijden blijven lang” (februari 2025)
- Trend: stijgend (dec 2022: 87.114 → dec 2023: 97.450 → okt 2024: 108.878)
Jeugdbescherming en jeugdreclassering
- Begin 2024: ±1.343-1.500 kinderen zonder vaste jeugdbeschermer
- Bij 7 van 13 gecertificeerde instellingen >100 kinderen op wachtlijst
- IGJ-inspecties (feb-sep 2025): wettelijke termijnen breed overschreden
- Situatie houdt in 2025 aan
Medisch-specialistische zorg
- Regionaal overschrijding Treeknorm (diagnostiek 4 weken; behandeling 7-10 weken)
- Doorlopende overschrijdingen blijven bestaan ondanks verplichte monitoring
Langdurige zorg (Wlz)
- Q1-2025: 18.438 wachtenden (lichte daling t.o.v. Q4-2024: 21.058)
- 95% heeft overbruggingszorg, druk blijft hoog
Pleegzorg
- Eind 2024: ~900 kinderen wachten op pleeggezin (+5% vs. 2023)
- Wachtlijst blijft in 2025 “onverminderd hoog”
1.2 Asiel en migratie
IND-procedures
- Gemiddelde wachttijd start procedure: ~53 weken (februari 2025)
- Wachten op eerste gehoor: ~11 weken
- Wachten op tweede gehoor: ~79 weken
- Wettelijke beslistermijn (6 maanden) structureel overschreden
- COA: structurele opstopping opvang door trage uitstroom naar gemeenten
1.3 Onderwijs
Speciaal onderwijs ((v)so)
- ±30% van (v)so-scholen heeft wachtlijst (najaar 2024)
- Oorzaak: capaciteitstekort t.o.v. groei leerlingen met extra ondersteuningsbehoefte
1.4 Arbeidsmarkt en uitvoering
UWV (WIA-beoordelingen)
- Wachttijden lopen in 2025 weer op na verbetering 2023-2024
- UWV voert 60-plus-maatregel opnieuw in (september 2025)
- Streven: maximaal 6 maanden wachttijd
CBR (rijexamens)
- Gemiddelde wachttijd: ~12 weken (medio 2025)
- Norm: 7 weken
- Sterke regionale variatie
1.5 Kinderopvang
- ~70% van locaties heeft wachtlijst (januari 2025)
- Personeelstekort blijft hardnekkig
1.6 Huisvesting
Sociale huur
- Landelijk aanhoudende lange wachttijden
- Amsterdam: gemiddeld 9,8 jaar (2024), aantal woningzoekenden stijgt
- Druk blijft hoog door beperkte voorraad
1.7 Infrastructuur
Elektriciteitsnet (netcongestie)
- 11.000 → 14.000 aanvragen voor zakelijke aansluitingen in korte tijd
- Medio 2025: 1.055 prioriteitsverzoeken (vs. 739 eind 2024)
- Wachttijden: tot jaren voor grootverbruikers
1.8 Rechtspraak en justitie
Strafrechtketen
- Doorlooptijden laten geen eenduidige verbetering zien (2024-2025)
Rechtspraak (civiel/bestuursrecht)
- Raad van State Omgevingskamer: +14% instroom (2024)
- Doorlooptijdreductie is doel, maar druk blijft
1.9 Vergunningen
Omgevingswet
- Beslistermijn: 8 weken + 6 weken verlenging
- Complexe procedures leiden tot langere feitelijke doorlooptijd
Stikstofvergunningen
- Lange en onzekere procedures
- Juridische onzekerheid veroorzaakt oponthoud bij projecten
2. Overkoepelende oorzaken
2.1 Primaire drivers
- Personeelstekorten (zorg, jeugdbescherming, IND, CBR, rechtspraak, kinderopvang)
- Capaciteitstekort (bedden, plekken, pleeggezinnen, netcapaciteit, examenbanen)
- Infrastructuurknelpunten (elektriciteitsnet, gebouwde capaciteit)
- Keten-doorstroom stokt (ziekenhuis→VVT, COA→gemeenten, verwijzing→behandeling)
- Fragmentatie & inkoop (veel schakels, uiteenlopende lokale afspraken)
- Ontbreken harde wachttijdnormen of zwakke handhaving
- Juridische onzekerheid (bezwaar/beroepstapeling bij stikstof, asiel, omgevingsrecht)
- Vraaggroei en complexiteit (vergrijzing, zwaardere casuïstiek, elektrificatie)
- Verkeerde financieringsprikkels (volume/uur i.p.v. resultaat/doorstroom)
- IT/procesmaturiteit laag (nieuwe stelsels/DSO, legacy-systemen, beperkte datasturing)
2.2 Systeemdiagnose: Staat van de Uitvoering
De jaarlijkse monitor Staat van de Uitvoering (2025) bevestigt dat complexe wet- en regelgeving en slechte gegevensdeling het grootste knelpunt blijven voor uitvoering van overheidsbeleid.
2.3 Specifieke casestudies
Jeugdzorg als exemplarisch voorbeeld
- Stelselkeuze 2015 (decentralisatie): fragmentatie, veel contracten/inkoop, hoge transactiekosten
- Geen harde wachttijdnorm: overheid liet eerst onderzoeken of normering zinvol/haalbaar is; conclusie was “complex, sectorbreed variërend” → intussen ontbreken bindende normen
- Structureel tekort jeugdbeschermers: honderden tot >1.000 kinderen zonder vaste professional
- Veel partijen, onduidelijke regie: IGJ/IJenV signaleren ketenproblemen
- Hervormingsagenda 2023-2028: verbetering loopt traag door schaal en financiering
3. Theoretische duiding: Panarchie en rigidity traps
3.1 Panarchie-cyclus (r → K → Ω → α)
De panarchie-theorie (Holling, Gunderson) beschrijft adaptieve cycli in complexe systemen:
- r-fase (groei): Vraag neemt toe, beleid stapelt ambities, capaciteit groeit ongecoördineerd mee
- K-fase (conservering/rigiditeit): Regels, contracten, IT en governance verharden → rigidity trap: efficiëntie ↑, veerkracht ↓
- Ω-fase (ontbinding): Schokken (arbeidskrapte, wetwijziging, instroompieken) breken het systeem → wachtrijen exploderen
- α-fase (heroriëntatie): Ruimte voor redesign, maar vaak onvoldoende “remember” van werkende patronen → terugval in hetzelfde patroon
3.2 Diagnose Nederlandse situatie
K-fase signalen (rigidity trap):
- Veel uitzonderingsroutes en audit-gedreven verantwoording
- Vendor lock-in bij IT
- Vaste budgetten zonder doorstroom-KPI’s
- Strak gecontracteerde uren, smalle functieprofielen
- Harde ketenafhankelijkheden → lage wendbaarheid
Ω-fase signalen (crisis):
- Plotse wachttijdsprongen na schokken
- Noodscenario’s, triage
- Werkvoorraad die niet meer krimpt
α-fase faalt (heroriëntatie lukt niet):
- Pilots zonder opschaalpad
- Kennis blijft lokaal
- Tijdelijke geldinjecties zonder structurele herontwerpkeuzes
3.3 Causale mechanismen
Blame avoidance (schuld-vermijding)
- Bestuurders mijden risico’s die tot verwijt kunnen leiden
- Vertraging en “doorschuiven” beperken politieke schade
Administrative burden (bewust frictie inbouwen)
- Drempels (formulieren, bewijs, wachttijden) kunnen zo worden ontworpen dat toegang tot rechten/subsidies feitelijk afneemt
- In de literatuur expliciet beschreven als politieke tactiek
Policy drift (niet bijstellen → stilstand)
- Regels worden niet geüpdatet bij veranderende omstandigheden
- Uitkomsten verschuiven zonder formeel besluit → de facto stagnatie
Street-level bureaucracy
- Uitvoerders moeten met schaarse middelen en veel regels “coping” toepassen
- Resulteert in wachtrijvorming en caseload-triage
4. Institutionele context: Wat weten adviesorganen?
4.1 Beschikbare kennis
Wetenschappelijke Raad voor het Regeringsbeleid (WRR)
- Rapport “Deskundige overheid” (8 juli 2025): pleit voor wendbare, veerkrachtige en deskundige staat
- Benadrukt noodzaak van adaptieve capaciteit
Algemene Rekenkamer (ARK)
- Toont dat uitvoeringstoetsen vaak te laat/te smal zijn
- Waarschuwt voor personeelstekorten als structureel risico
- Constateert dat uitvoerbaarheid onvoldoende integraal wordt getoetst vóór besluitvorming
Adviescollege Toetsing Regeldruk (ATR)
- Signaleert jaarlijkse toename complexiteit
- Adviseert schrappen/versimpelen
- Niet alle adviezen worden opgevolgd (Jaarverslag 2024)
Raad van State
- Waarschuwt herhaaldelijk voor complexe wetgeving (o.a. Omgevingswet)
- Wijst op kwaliteit van wetgeving als sleutel
- Signaleert uitvoeringslasten
Centraal Planbureau (CPB) / Planbureaus
- Rekent partijprogramma’s door (Keuzes in Kaart)
- Focus vooral op macro-effecten (lasten, koopkracht, EMU)
- Minder aandacht voor uitvoerbaarheid/ketencapaciteit
4.2 Waarom vertaalt kennis niet naar beleid?
Verkiezingsprikkels
- Programma’s framen voordelen, niet trade-offs
- Buffers, redundantie, ‘minder regels met echte keuzes’ scoren slecht in campagnes
- Moeilijk te kwantificeren in standaard CPB-doorrekening
Complexiteit verkoopt slecht
- Panarchie/veerkracht is abstract
- Partijen kiezen herkenbare maatregelen boven stelselontwerp
Timing
- Adviezen komen vaak na programmaschrijffase
- Worden “technisch” weggeschreven in uitvoeringsbrieven i.p.v. politieke keuzes
Verkeerde KPI’s en prikkels
- Budget- en contractsturing op volume/compliance
- Nauwelijks op doorstroom/wachttijd/WIP
- Instituten en politiek worden niet afgerekend op adaptiviteit en wachttijdreductie
Politiek risicomanagement → regelreflex
- Uit angst voor incidenten en aansprakelijkheid worden lagen toegevoegd (protocol, bewijs, verantwoording)
- RvS/ATR signaleren dit herhaaldelijk
5. Internationale vergelijking
5.1 Het probleem is OECD-breed
Verenigd Koninkrijk (NHS)
- Wachtlijst: ~7,4 miljoen afspraken (± 6,25 mln personen) in 2025
- 2,8 miljoen >18 weken wachten
- DVSA rijexamens: gemiddeld 15-22 weken wachttijd (doel 7 weken pas 2026)
Canada
- Wachttijden voor prioriteitsingrepen langer dan 2019
- Mediane wachttijd: 30 weken (2024 survey) — historisch hoog
Europese Unie (asiel)
- ~918.000 eerste-aanvraag dossiers in behandeling (juni 2025)
- Totaal incl. beroep: ~1,3 miljoen
Verenigde Staten (immigratie)
- 3,43 miljoen zaken open in immigratierechtbanken (augustus 2025)
- Waarvan 2,27 miljoen asielzaken
Duitsland/VK/NL (netcongestie)
- Duitsland: ~7 jaar wachten op netaansluiting datacenters
- VK: 5-7 jaar
- Nederland: tot 10 jaar (indicatief), recent 14.000 bedrijven op wachtlijst
5.2 Gemeenschappelijke oorzaken
OECD-data bevestigt:
- Structurele workforce-krapte in zorg en langdurige zorg
- Infrastructuur-/capaciteitslimieten
- Keten-doorstromproblemen
- Complexe wet-/regelstelsels
- Dezelfde rigidity traps: veel systemen zitten vast in K-fase; schokken → Ω-fase met wachtrij-sprongen; echte α-heroriëntatie is beperkt
6. Conclusies
6.1 Kerndiagnose
Dit is geen kennistekort, maar een prikkel- en vertaalprobleem. De adviezen bestaan (WRR, ARK, RvS, ATR, SvdU), maar instituten en politiek worden niet afgerekend op adaptiviteit en wachttijdreductie. Het ontbreekt aan:
- Harde wachttijdnormen met consequenties
- Doorstroom-KPI’s in plaats van volume-bekostiging
- Adaptieve buffers en redundantie
- Ketenregie met geïntegreerde datasturing
- Uitvoerbaarheidstoetsen vroeg in wetgevingsproces
6.2 Zonder explicitie panarchie-denken…
…produceert de politiek precies de dynamiek die wachtrijen laat groeien:
- Mismatch vraag ↔ adaptieve capaciteit
- Regelreflex bij incidenten
- → Minder veerkracht
- → Oplopende wachtrijen bij elke schok
6.3 Bewijs dat het anders kan
Adaptive (Delta) Policy Pathways in Nederlands waterveiligheid (Deltares, Deltaprogramma) laat zien dat adaptief bestuur wél werkt:
- Tipping points en kantelpunten
- Scenario-planning
- Beslisvensters
- Herconfigureren van paden
Dit is een bruikbaar sjabloon voor andere domeinen.
6.4 Urgentie
Met aanhoudende wachttijden in vrijwel alle publieke domeinen en internationale bevestiging van hetzelfde patroon is er een dringende noodzaak tot:
- Erkenning dat het huidige besturingsmodel structurele rigiditeit produceert
- Verankering van adaptieve capaciteit in governance
- Invoering van doorstroom-KPI’s en wachttijdnormen met consequenties
- Structurele investering in buffers en redundantie
- Beperking regelreflex ten gunste van professionele discretie
De kennis is er. De tools zijn er. De politieke wil om deze systematisch toe te passen ontbreekt.
Deze probleembeschrijving is gebaseerd op overheidsbronnen (NZa, IGJ, WRR, ARK, RvS, ATR, Staat van de Uitvoering), wetenschappelijke literatuur (panarchie-theorie, adaptive capacity) en internationale vergelijkingsdata (OECD, EU, VK, Canada, VS) uit de periode 2024-2025.
English Version
Bridging System Dynamics and Decision-Making: A Panarchy-Cynefin Integration
Introduction
Organizations frequently struggle with a fundamental tension: some stakeholders see “the system” (markets, ecosystems, societal forces), while others focus on “just doing” (projects, KPIs, processes). This disconnect often leads to mismatched interventions—applying standardization where experimentation is needed, or pursuing optimization when stability is already brittle.
Two conceptual frameworks offer a powerful synthesis: Panarchy reveals how complex adaptive systems evolve across multiple scales and temporal rhythms, while Cynefin provides actionable guidance for intervention strategies suited to different contexts. Together, they bridge diagnosis and action: Panarchy helps you understand where your system is in its adaptive cycle and which scale matters; Cynefin tells you how to act given that context.
Panarchy: The Adaptive Cycle Across Scales
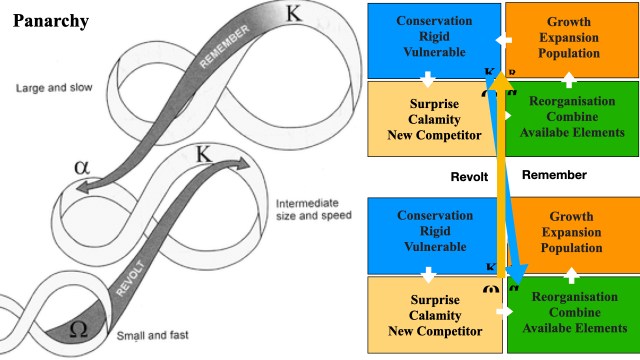
Panarchy, developed by ecologist C.S. Holling and colleagues, describes how complex systems navigate through four recurring phases (Holling, 2001; Gunderson & Holling, 2002):
r (Exploitation/Growth): Rapid growth and colonization. High variety, experimentation, and resource accumulation. Systems are opportunistic and relatively resilient to disturbance through diversity.
K (Conservation/Consolidation): Increasing connectivity and efficiency. Resources become locked up in optimized structures. Reduced variety increases system fragility—the “rigidity trap.” Small disturbances that previously would be absorbed now have disproportionate effects.
Ω (Release/Creative Destruction): Rapid collapse or reorganization. Accumulated rigidity meets disturbance; established structures break down and release previously bound resources.
α (Reorganization): Recombination and renewal. Released resources and surviving “legacy” structures create novel configurations. Systems are highly sensitive to initial conditions—small variations can lead to vastly different trajectories.
Cross-Scale Dynamics: Revolt and Remember
Panarchy’s distinctive contribution lies in its explicit treatment of cross-scale interactions (Holling et al., 2002):
Revolt (upward causation): Events at smaller, faster scales can cascade upward when larger, slower systems are vulnerable (late K phase). A localized disturbance in a fragile macro-system can trigger system-wide release.
Example: A series of minor safety incidents in one production line triggers sector-wide regulatory intervention when the industry is already under scrutiny.
Remember (downward causation): During α (reorganization), the larger, slower-changing system constrains and shapes the smaller system’s reorganization, preserving core patterns and preventing every crisis from producing radical novelty.
Example: After a market disruption, new business models still conform to established customer expectations and regulatory frameworks—the larger system “remembers” and reconstrains.
Implication: Interventions at scale A inevitably affect scale B. Governance and experimentation must be explicitly designed with cross-scale consequences in mind.
Cynefin: Sense-Making for Action
Cynefin, developed by Dave Snowden, is a sense-making framework that helps determine appropriate responses based on the nature of causality and constraints in a given context (Snowden & Boone, 2007; Snowden, 2023):
Clear (formerly Obvious): Cause-effect relationships are self-evident to all. Best practices apply. Action pattern: Sense → Categorize → Respond. Standardize, create SOPs.
Complicated: Cause-effect relationships exist but require analysis or expertise to discern. Good practices exist. Action pattern: Sense → Analyze → Respond. Deploy experts, conduct root-cause analysis.
Complex: Cause-effect relationships are only coherent in retrospect. Patterns emerge from interaction. Action pattern: Probe → Sense → Respond. Run safe-to-fail experiments, amplify what works, dampen what doesn’t.
Chaotic: No perceivable cause-effect relationships. Crisis conditions. Action pattern: Act → Sense → Respond. Establish order rapidly, then transition to Complex for learning.
Disorder: Unclear which domain applies. Action pattern: Break the situation into components that can be assessed separately.
Constraints as Levers
Cynefin emphasizes the role of constraints in shaping system behavior (Snowden & Rancati, 2021):
Governing constraints (rigid, fixed) suit ordered domains (Clear/Complicated): rules, standards, contracts.
Enabling constraints (flexible, directional) suit unordered domains (Complex): principles, boundaries, guardrails that allow pattern formation without prescribing outcomes.
The Integration: Panarchy for Context, Cynefin for Intervention
While Panarchy is structurally richer (multi-scale, explicit adaptive phases), Cynefin offers a richer intervention grammar (action patterns, constraint types, liminal transitions). Together they form a diagnostic-prescriptive pair.
Heuristic Mapping
The adaptive cycle phases can be loosely mapped to Cynefin domains, suggesting intervention strategies:
| Panarchy Phase | Typical Cynefin Domain | Primary Action Pattern | Constraint Type |
|---|---|---|---|
| r (early growth) | Complex | Probe → Sense → Respond (parallel experiments) | Enabling (direction, boundaries) |
| K (consolidation) | Clear/Complicated | Sense/Analyze → Respond (standardize, optimize) | Governing (rules, standards) |
| Ω (release) | Chaotic | Act → Sense → Respond (stabilize, contain) | Temporarily hard; reduce afterward |
| α (reorganization) | Complex (liminal) | Probe → Sense → Respond (pattern formation) | Enabling + clear amplify/dampen signals |
Critical insight: The mapping is not deterministic. A consolidated operation (K phase) may contain both Clear elements (standard processes) and Complicated elements (requiring expert optimization). The framework guides situational assessment rather than prescribing universal responses.
A Practical Approach in Five Steps
1. Identify Three Scales Explicitly
Micro: Teams, products, projects Meso: Organization, value chain, partnerships
Macro: Market, sector, regulatory environment, society
2. Assess Adaptive Phase per Scale
For each scale, determine the current phase (r/K/Ω/α) using 2-3 observable indicators:
- Variety (increasing or decreasing?)
- Response time to disturbance
- Frequency and severity of disruptions
- Resource flexibility vs. lock-in
- Customer/stakeholder diversity
3. Map to Cynefin Domain and Select Intervention Style
- r/Complex: Multiple safe-to-fail probes with clear hypothesis and signal detection
- K/Clear: Maintain standards but preserve redundancy; cap new rules
- K/Complicated: Expert-led optimization with deliberate variation preservation
- Ω/Chaotic: Timeboxed stabilization (e.g., 72 hours), then migrate to Complex
- α/Complex: Deliberate pattern formation through probes and rapid scale/kill decisions
4. Tune Constraints According to Scale and Leverage
Where you have ownership (micro/meso): Use governing constraints (SOPs, contracts, API specifications)
Where you have influence (meso/macro): Use enabling constraints (principles, sandbox environments, coalition-building, incentive structures)
Cross-scale check: Does this intervention reduce option space at another scale unnecessarily?
5. Design for Cross-Scale Dynamics
Revolt risk management (upward):
- In late K: Institute leading indicators (near-misses, variance reduction, brittleness metrics)
- No new hard controls without fragility assessment
- Design fail-safe boundaries so small failures don’t cascade to macro-level release
Remember leverage (downward):
- In α/Complex: Translate macro-principles into guardrails that guide but don’t suffocate
- Use budget caps, exposure limits, timeboxes rather than detailed rules
- Allow micro-level experimentation within macro-level constraints
Illustrative Case
Context: A service provider experiencing margin erosion and rising customer churn.
Diagnosis across scales:
Macro (market): α/Complex—new entrants, shifting customer preferences, regulatory evolution
Cynefin: Complex → Launch 5 time-boxed co-creation probes with customer segments (6 weeks, €25k each). Pre-define amplify signals (repeat engagement, referral rates) and dampen signals (high friction, narrow appeal).
Meso (operations): K/Clear—highly optimized processes, low redundancy, rigid supplier relationships
Cynefin: Clear/Complicated → Maintain core standards but introduce deliberate variety: activate second-source suppliers, cap new rules at one per quarter, create “variation slots” for experimentation.
Micro (Team X): r/Complex → One probe shows traction
Cynefin: Define SOP within 2 sprints (Complex → Clear transition), assign ownership, set audit date and “unfreeze condition” (when the SOP can be reopened for revision).
Cross-scale safeguards:
- Revolt prevention: Operations team empowered to halt any probe causing >10% resource spike to prevent cascading stress
- Remember application: All probes required to maintain compliance with data privacy regulations (macro constraint as enabler, not blocker)
Outcome: The organization consolidates what works, experiments where it can, and stabilizes when it must—without applying uniform approaches across contexts.
Essential Do’s and Don’ts
Do
- Maintain portfolio balance: Parallel probes in Complex; systematic kill/scale decisions
- Preserve variety in K: Redundancy, modularity, “patchiness” prevent rigidity traps
- Define exit criteria: When does something transition from Complex → Complicated → Clear?
- Monitor cross-scale signals: Small-scale volatility + late-stage K = revolt risk
Don’t
- Over-control in Complex: Analysis workshops without action yield false confidence
- Tighten K further: When fragility signals emerge, adding controls accelerates toward Ω
- Let Chaotic persist: Timebox stabilization; migrating to Complex enables learning
- Ignore scale mismatches: Micro-optimization can create macro-fragility
Lightweight Artifacts for Implementation
Portfolio Board (single A3 page):
- Columns: Clear | Complicated | Complex | Chaotic
- Rows: Micro | Meso | Macro
- Cards contain: objective, hypothesis, phase (r/K/Ω/α), constraint type, measurement and stop signals, cross-scale risks
Probe Card (Complex domain):
- Hypothesis: What pattern are we looking for?
- Minimum observable signal: What’s the smallest evidence of success/failure?
- Amplify/dampen criteria: When do we scale? When do we stop?
- Maximum acceptable risk: What’s the blast radius if this fails?
- Stop date: When do we decide?
Stabilization Card (Chaotic domain):
- 72-hour objective: What stable state are we aiming for?
- Roles and decision rights: Who can act unilaterally?
- Return criteria: What signals the transition to Complex?
SOP Card (Clear domain):
- Source: Which probe validated this approach?
- KPIs: How do we measure standard performance?
- Audit frequency: When do we verify compliance?
- Unfreeze condition: Under what circumstances can this be reopened?
Conclusion: Synthesis in One Sentence
Panarchy teaches you to look at the right scale and recognize the adaptive phase; Cynefin helps you intervene appropriately given that context. Together, they prevent over-consolidation, accelerate learning, and enhance resilience by matching your actions to system dynamics rather than imposing uniform solutions across fundamentally different contexts.
Annotated References
Gunderson, L.H., & Holling, C.S. (Eds.). (2002). Panarchy: Understanding Transformations in Human and Natural Systems. Island Press.
→ The foundational text on Panarchy, introducing the adaptive cycle (r-K-Ω-α) and cross-scale dynamics (revolt and remember). Essential for understanding how systems evolve across temporal and spatial scales. Includes case studies from ecology, resource management, and social systems.
Holling, C.S. (2001). Understanding the Complexity of Economic, Ecological, and Social Systems. Ecosystems, 4(5), 390-405.
→ Holling’s synthesis paper connecting adaptive cycles to resilience theory. Introduces the concept of the “rigidity trap” in late K phase and explains why optimized systems become fragile. Particularly relevant for organizational applications.
Holling, C.S., Gunderson, L.H., & Peterson, G.D. (2002). Sustainability and Panarchies. In Gunderson & Holling (Eds.), Panarchy: Understanding Transformations in Human and Natural Systems (pp. 63-102). Island Press.
→ Detailed explanation of cross-scale interactions, including the mechanics of revolt (fast→slow) and remember (slow→fast). Critical for understanding why interventions at one organizational level affect others unexpectedly.
Snowden, D.J., & Boone, M.E. (2007). A Leader’s Framework for Decision Making. Harvard Business Review, 85(11), 68-76.
→ The most widely cited introduction to Cynefin for business audiences. Clearly explains the five domains and their respective action patterns (sense-categorize-respond, sense-analyze-respond, probe-sense-respond, act-sense-respond). Accessible entry point for practitioners.
Snowden, D.J. (2023). Cynefin: Weaving Sense-Making into the Fabric of Our World. Cognitive Edge.
→ Snowden’s comprehensive treatment of Cynefin’s evolution, including liminal domains, constraint theory, and the distinction between sense-making frameworks and process models. Essential for understanding why Cynefin is not a maturity model or decision tree.
Snowden, D.J., & Rancati, A. (2021). Managing Complexity (and Chaos) in Times of Crisis. LIMEXec Discussion Paper.
→ Applies Cynefin specifically to crisis management, explaining the transition between domains (especially Chaotic→Complex→Complicated→Clear) and the role of constraints in each. Highly relevant for organizational change and incident response.
Walker, B., & Salt, D. (2006). Resilience Thinking: Sustaining Ecosystems and People in a Changing World. Island Press.
→ Bridges Panarchy and practical resilience strategies. Explains thresholds, alternate stable states, and how deliberate management of variety can prevent rigidity traps. Useful for translating ecological concepts into organizational practice.
Kurtz, C.F., & Snowden, D.J. (2003). The New Dynamics of Strategy: Sense-Making in a Complex and Complicated World. IBM Systems Journal, 42(3), 462-483.
→ Early articulation of Cynefin’s application to strategy, emphasizing the difference between complex and complicated problems and why traditional analysis fails in emergent contexts. Introduces safe-to-fail experimentation as a strategic practice.
Allen, C.R., Angeler, D.G., Garmestani, A.S., Gunderson, L.H., & Holling, C.S. (2014). Panarchy: Theory and Application. Ecosystems, 17(4), 578-589.
→ Reviews 12 years of Panarchy applications across disciplines. Highlights common patterns and pitfalls, particularly over-control in late K leading to reduced resilience. Strong empirical grounding for the framework.
Snowden, D.J. (2010). The Cynefin Framework. Video lecture and subsequent publications.
→ Snowden’s explanation of how Cynefin evolved from IBM’s knowledge management work and how it differs from other complexity frameworks. Emphasizes that Cynefin is descriptive (sense-making) rather than prescriptive (methodology), avoiding the trap of treating all problems as if they require the same approach.
Summary
This article argues that government bureaucracies worldwide, including the Netherlands, are collapsing under their own rigidity. Using Panarchy theory (adaptive cycles in complex systems) and the Cynefin framework (decision-making contexts), the author demonstrates how over-regulation leads to “rigidity traps” where systems become fragile and unable to adapt. The piece combines theoretical frameworks with extensive empirical data showing structural wait times across all Dutch public sectors (healthcare, asylum, education, housing, infrastructure) in 2024-2025. The core diagnosis: governments optimize for efficiency at the cost of resilience, turning small disruptions into cascading failures. The solution proposed is adaptive governance using Panarchy-Cynefin integration to match interventions to system dynamics rather than applying uniform solutions.
Chapter Outline
Part 1: Theoretical Framework
- Introduction – The bureaucratic crisis and conceptual tools
- Panarchy Theory – Four-phase adaptive cycles (growth, consolidation, release, reorganization)
- Cynefin Framework – Five decision-making domains and constraint types
- Integration Methodology – Five-step approach combining both frameworks
- Practical Application – Portfolio management, probe design, and cross-scale dynamics
Part 2: The Dutch Crisis (Facts/Feiten)
- Executive Summary – Structural mismatch between demand and adaptive capacity
- Wait Times by Sector – Detailed data across 9 domains:
- Healthcare (GGZ, youth protection, specialist care)
- Asylum and migration
- Education
- Labor market
- Childcare
- Housing
- Infrastructure (electricity grid)
- Justice
- Permits
- Root Causes – Staff shortages, capacity limits, fragmented governance, wrong incentives
- Theoretical Diagnosis – Netherlands in K-phase “rigidity trap”
- Institutional Knowledge Gap – Why advisory bodies’ recommendations aren’t implemented
- International Comparison – Similar patterns in UK, Canada, US, Germany
Part 3: Conclusions & Way Forward
- Core Diagnosis – Not a knowledge deficit but a misaligned incentive problem
- Evidence of Alternatives – Dutch Delta Programme as proof adaptive governance works
- Call to Action – Need for hard wait-time norms, adaptive buffers, and throughput KPIs
The article effectively bridges abstract systems theory with concrete policy failure, making a case for fundamental governance reform.